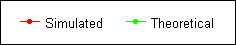
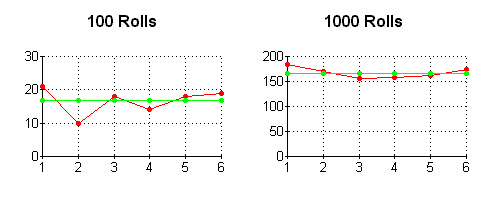
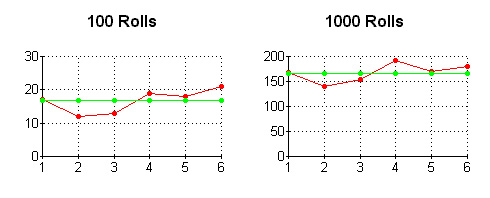
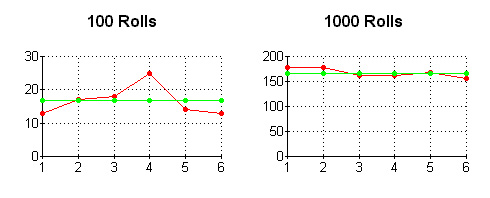
Teaching Tips - MathProbability Examples With DiceThis article is to help probability students see what probability "theory" looks like in "actual" situations. It is often a lot more random than most people think. Below are some examples of what happens when you roll dice, compared to what probability theory tells us "should" happen. For these experiments, I used a spreadsheet program to "simulate" the rolloing of dice. Testing with actual dice, indicated that this method produces results that are realistic enough for the purpose of understanding probability better (I couldn't tell the simulated results from actual results). Description of GraphsIn the graphs below, the green is the theory, the red is what I actually got (from the simulator). For each graph, the horizontal axis shows all the possibilities, for that situation. (For one die, you can get a 1, 2, 3, 4, 5, or a 6. For two dice added together, you can get 2, 3, 4, 5, 6, 7, 8, 9, 10, 11, or 12.) The vertical axis shows the "number of times" each possibility showed up or should show up. For example, in the first graph, where a single die was rolled 100 times, the number 1 came up 21 times; the number 2 came up 10 times; the number 3 came up 18 times, and so on. For each pair of graphs, the left graph shows the first 100 rolls. The right graph, shows the first 100 rolls plus 900 more, for a total of 1000 rolls. (So, the right graph includes the first 100 rolls from the left graph.) Rolling One DieBelow are some results for rolling one die.
You Can Try This at HomeYou can try this experiment fairly easily at home, with one die, and a pencil and paper. On the paper, make six columns, one for each possibility. Label them 1, 2, 3, 4, 5, and 6, as shown below. Then each time you roll the die, put a tick mark in the column for the number that came up (so if you get a 4, put a tick mark in the 4 column). The length of tick marks in each column will be a rough graph, like my graphs above. Rolling One Die
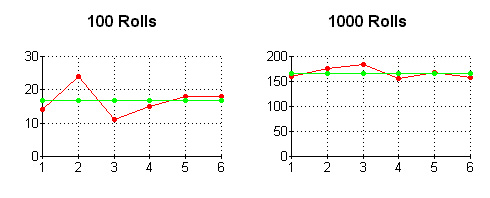
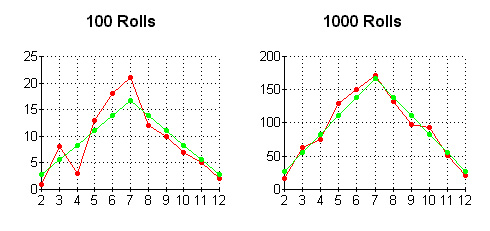
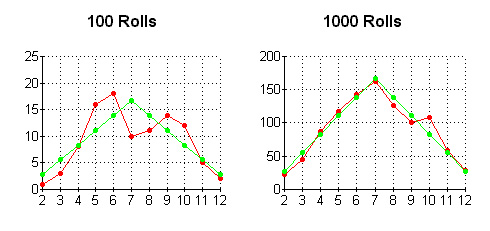
Rolling Two DiceBelow are some results for rolling two dice. Note that 7 does not always show up the most times.
ConclusionProbability theory works, but in reality, the results are often more random than we might expect. This is because probability really predicts the average behavior over a large number of cases. It does not predict one case.
© Copyright 2003 to 2009. All articles on this site are copyrighted. |
||||||||||||